
Projects
Example Reports
VIBRATION SURVEY
Scope of Report
To measure vibration on the floor of the offices of and to suggest possible sources of intermittent higher magnitude vibration.
1. INTRODUCTION
1.1 ... occupy an office block in Hammersmith.
1.2 Some occupants of the offices have commented that they occasionally feel a vibration pulse through the floor.
1.3 The vibration is most noticed on the sixth floor.
1.4 Civil Engineering Dynamics were consulted to suggest possible sources for the vibration pulse.
2. THE SITE
2.1 The offices are a seven-storey, concrete-framed building with a basement used for building services and service staff.
2.2 Indicative floor plans and orientation to the flyover are shown in Figure 1.
2.3 The building has concrete floors with a 'false' floor suspended approximately 200 mm above. The suspended floor is constructed from sections approximately 5 m x 0.5 m.
2.4 The offices are all open plan, with rooms being sub-divisions using light-weight 'false' walls.
2.5 Most floors are arranged with the workspaces to the inside and outside of a single corridor that forks at the entrance and fire exit and runs along the middle of each half of the building (see Figure 1).
2.6 The sixth floor is arranged with offices around the outside, facing a central open area and wide corridor running along the middle of the building.
2.7 Two lifts serve the building from shafts in the north-eastern corner of the building. The lift motor is housed on the roof.
2.8 The flyover has a total of four lanes - two in each direction. The flyover passes the building level with the second floor.
2.9 There is an expansion joint in the flyover to the east of the building.
2.10 The building is clad in glass.
3. MEASUREMENT PROCEDURE
3.1 The survey took place on the 11th and 12th July 00.
3.2 The strategy for the survey was to measure the vibration simultaneously at a number of locations throughout the building so that when a pulse occurs, its relative existence and non-existence at the different locations can be used to make assumptions regarding the path and/or origin of the pulse.
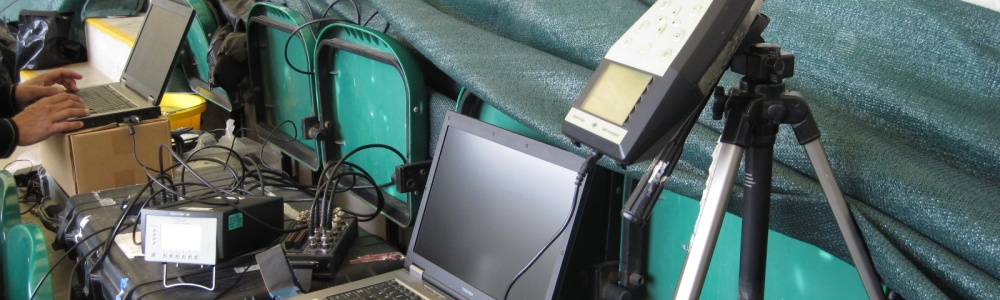
3.3 The measurement apparatus uses a laptop PC to measure and record signals from four vibration transducers.
3.4 The locations and/or orientations of the transducers are varied as the survey proceeds, and as successive assumptions are tested.
3.5 Equipment Used
3.5.1 The transducers are attached to the building using magnets. When the floor slab is measured, a metal washer is glued to the concrete using Rapid Araldite. When measurements are made radially, or on the suspended floor, metal right-angle brackets with spikes are used.
3.5.2 The transducers are four Bruel & Kjaer 4378 accelerometers with Bruel & Kjaer 2646 line drivers. A Kemo four-channel signal conditioner provides anti-alias filtering and amplification to the signal, and powering to the accelerometers.
3.5.3 The conditioned signals are measured and recorded using Toshiba Satellite Pro laptop PC with a National Instruments Data Acquisition PCMCIA Card installed. LabVIEW software and a bespoke data acquisition program are used to manage the data acquisition.
3.5.4 Four simultaneous channels are recorded in 16-second samples. These raw time histories are post-processed using Matlab software to gain detailed information about the magnitude and frequency content of the signals.
3.6 Measurement Locations
3.6.1 All the measurements were made at the north-western corner of the building. As far as possible, the accelerometers were located in the same place on each floor. Indicative locations are shown in Figure 1.
3.6.2 Eight different measurement set-ups were used. Tests 2, 7, and 8 were used most often. Table A lists the measurement set-up for each test.
Table A: Measurement Set-Ups
Test Channel 1 Channel 2 Channel 3 Channel 4 1 ground floor, vertical ground floor, radial 6th floor slab, vertical 6th floor slab, radial 2 ground floor, vertical 3rd floor slab, vertical 6th floor slab, vertical 7th floor slab, vertical 3 N/A 4 ground floor, vertical 3rd floor slab, vertical 6th floor slab, vertical 7th floor slab, vertical 5 ground floor, vertical 3rd floor slab, vertical 6th floor slab, vertical 7th floor slab, vertical 6 6th floor window frame, radial 6th floor raised, vertical 6th floor slab, vertical 6th floor raised, radial 7 outside, vertical ground floor, vertical 6th floor slab, vertical 7th floor slab, vertical 8 outside, vertical ground floor, vertical 6th floor slab, vertical 6th floor raised, vertical
3.6.3 The ground floor measurement was on the floor at the base of the fire escape stairs at ground level.
3.6.4 The outside measurement was made on a ground bearing paving slab at the front of the 'garden' in front of the building.
3.6.5 The floor slabs were accessed through hinged mains power outlets in the raised floor.
4. DISCUSSION
4.1 In total, 46 four-channel samples were taken over the whole measurement period. Only a small selection are displayed in this report.
4.2 Test 1
4.2.1 The purpose of the test is to investigate the relative magnitudes of vertical and radial vibration to the same input.
4.2.2 Two pairs of accelerometers are used, one orientated vertically, the other radially. Measurements are made on the ground floor and on the slab of the 6th floor.
4.2.3 Figure 2 shows a sample measurement of this test during a vibration event.
4.2.4 Figure 2 indicates that the vibration event is dominated by vertical motion. Note the low frequency horizontal motion of the 6th floor shown by Channel 4. This could be wind sway motion.
4.3 Test 2
4.3.1 The purpose of this test is to measure the frequency and magnitude of the vibration events at various locations and to determine whether the source is more likely to be inside or outside the building.
4.3.2 Four accelerometers are used. Each accelerometer is orientated vertically on the slab of the ground, 3rd, 6th, and 7th floors.
4.3.3 Figure 3 shows a sample measurement of the background vibration at the four measurement locations. This is the vibration levels in the absence of a vibration event or contamination such as people walking past a transducer.
4.3.4 Figure 4 shows two example measurements of vibration events.
4.3.5 As the event occurs simultaneously at the base of the building and on other floors, it could be assumed that the vibration source is outside the building, or if the source is in the building it is moving the whole structure.
4.3.6 Note that the vibration is a higher magnitude on the higher floors. This is because vibration is magnified up through the building.
4.3.7 The results are summarised in Figure 8. This plots the magnitude of the vibration against the dominant frequency of the event. The chart is from BS 6472: Guide to Evaluation of human exposure to vibration in buildings (1 Hz to 80 Hz). The numbered curves represent levels of vibration that are thought to be generally acceptable for various situations. Curve 1 is said to be the average threshold of human perception.
4.4 Test 3
4.4.1 A Diagnostic Instruments Di2200 Portable FFT Analyser was used to determine the approximate natural frequency of the section of the 6th floor under test.
4.4.2 An accelerometer was orientated vertically on the raised floor using a spiked metal plate. Our engineer performed a heel drop (where one falls from ones toes to ones heels in one clean movement) and recorded the resulting response of the floor.
4.4.3 The dominant low frequency recorded in this test was around 7 Hz.
4.4.4 The measurements of vibration events show dominant low frequencies of between 7 and 10 Hz in the response of the floors. Therefore, we suggest that it is reasonable to assume that the floors are responding at, or close to, their resonance frequencies.
4.4.5 Likely sources could be a transient source, where a high magnitude pulse causes all connected systems to respond at their individual resonance frequencies, or a source generating a signal around 7 to 10 Hz that forces connected systems to respond at the forcing frequency.
4.4.6 At this point of the survey it was assumed that the source might be one of the following:
- A pulse is generated in the flyover when vehicles move over the expansion joint because it is a discontinuity in the road surface. The pulse is transmitted to the floors via the foundations of the building and flyover.
- The lifts coming to a halt at the top or bottom of their travel and causing a pulse to be initiated through the building - exciting floors at their resonance frequencies.
- People walking at a sub-harmonic of around 7 to Hz on other floors causing a resonance to build up in other floors.
- Air blasts from passing high-sided vehicles or wind gusts causing the cladding to vibrate, which then causes the floors to vibrate.
4.5 Test 4
4.5.1 This test was undertaken in the evening after most staff had left the building.
4.5.2 The measurement locations are the same as for Test 2.
4.5.3 The lift was ridden from the seventh floor directly to the ground floor and vice versa a number of times.
4.5.4 No response in the floor could be initiated by any combination of lift movements.
4.5.5 Therefore, we suggest that it is reasonable to conclude that the lifts are not the cause of the perceptible vibration events.
4.6 Test 5
4.6.1 This test was also undertaken in the evening after most staff had left the building.
4.6.2 The measurement locations are the same as for Test 2.
4.6.3 An engineer walks at a constant pace (regulated by a metronome) in heavy strides on some of the other floors of the building. The walking pace was set at 105 bpm, one quarter of 7 Hz and the closest fraction of 7 Hz to a reasonable walking pace.
4.6.4 No response in the floor could be initiated by any combination of walking movements.
4.6.5 Therefore, we suggest that it is reasonable to conclude that footfall induced vibration is not the cause of the perceptible vibration events.
4.7 Test 6
4.7.1 The purpose of this test is to determine the likelihood of movements of the cladding being the source of the perceptible vibration events on the 6th floor.
4.7.2 Four accelerometers are all used on the 6th floor. One fixed horizontally to a window frame, the other three are mounted horizontally or vertically on the raised floor or slab below. Set-up is shown in Figure 5.
4.7.3 Figure 5 shows a sample measurement of this test.
4.7.4 There is no correlation between the movements of the cladding and the movements of the floor.
4.7.5 Therefore, we suggest that it is reasonable to conclude that movements of the cladding are not the cause of the perceptible vibration events.
4.8 Test 7 & 8
4.8.1 The purpose of these measurements is to test the assumption that the expansion joint on the flyover is the source of the vibration events and to monitor for as long a period as possible to increase the possibility of recording a particularly high magnitude of event.
4.8.2 Accelerometer locations are as shown in Figures 6 & 7. An accelerometer is located outside the building, as close to the flyover as possible.
4.8.3 Test 8 also measures the relative response of the raised floor in relation to the slab below.
4.8.4 With reference to Figures 6 & 7, there appears to be a strong co-incidence between a high vibration measured outside, near to the flyover, and high vibration measured on the 6th floor.
4.8.5 Therefore, we suggest that it is reasonable to conclude that vehicles passing the expansion joint in the flyover is the most likely source of the perceptible vibration events on the 6th floor.
5. CONCLUSIONS
5.1 Based on the observations of this survey, it is our opinion that the source for the perceptible vibration events on the 6th floor is vehicles passing the expansion joint in the flyover.
5.2 There is also a correlation between seeing a heavy vehicle pass the expansion joint and measuring a high vibration on the 6th floor.
5.3 Every vehicle, and combination of vehicles passing the expansion joint generates a vibration pulse that causes a response in the 6th floor that can be measured.
5.4 The response of the floor is around 7 to 10 Hz and appears to be approximately of the form of a idealised mass-spring-damper system. Figure 9 shows an example waveform filtered to remove all but the lowest frequencies. Figure 9 is a section of a measurement made on the raised 6th floor.
5.5 The magnitude of the response depends on the speed and weight of the vehicle passing the expansion joint. It is not possible to measure an event from after 16:00 on weekdays because the traffic is either at standstill or moving too slowly to cause a significant pulse.
5.6 Human Response
5.6.1 Figure 8 gives guidance regarding the expected human response to a vibration at a given frequency and magnitude, using BS 6472: Guide to Evaluation of human response to vibration in buildings (1 Hz to 80 Hz).
5.6.2 Each curve is a guide to what may be considered an acceptable level for a given situation. The curves are generated for continuous sine waves, so are not directly applicable to this source and must be treated with some caution. However BS 6472 does suggest curves suitable for evaluating impulsive vibrations.
5.6.3 BS 6472 explains the curves in the manner listed in Table B.
Table B: (from BS 6472)
5.6.4 BS 6472 also makes the following cautionary point:
' people exhibit wide variations of vibration tolerance. Specific values are dependent upon social and cultural factors, psychological attitudes and expected degree of intrusion.'
5.6.5 Accepting the variations due to traffic density and speed, and variation between individual responses, we would expect heavier traffic events (such as two co-incident lorries filled with rubble - examples of which can be seen on the Hammersmith Flyover) to result in a vibration event that is perceptible to some people to a lesser or greater extent on the higher floors of the building.
5.6.6 It would seem possible that the intermittent nature of occurrences of such events could coincide with the descriptions of the intermittent perceptions of vibration events.
5.6.7 Magnification of the vibration is seen at higher floors in the building. Figure 4 gives a number of examples where the vibration is higher on the 6th floor than on the 3rd floor.
5.6.8 However, the vibration on the 7th floor is rarely higher than that on the 6th floor. We suggest that this may be due to different loading of office furniture on each floor. Most floors have office furniture filling most of the floor-space in the middle of the building and around the edges, the 6th floor is much more open with a lesser density of furniture (see Figure 1). The lower mass floor vibrates at a greater magnitude than the heavier floors.
5.6.9 In conclusion, we would expect the levels of vibration measured in the offices to be acceptable to most people, most of the time. We note that many vibration events are above the average threshold of human perception. Therefore, we would expect that many events will be noticeable, and that some events may be considered unacceptable by some people, some of the time.
5.6.10 It may be useful to consider that were the upper floors of the building being used for sensitive processes (such as precision laboratory or high magnification photography) the vibration magnitudes would be considered unacceptable.
5.7 Structural Damage
5.7.1 Potential structural damage to buildings is assessed using the Peak Particle Velocity (PPV) of the vibration, measured in mm/s.
5.7.2 BS 7385: 'Evaluation and measurement for vibration in buildings, Part 1. Guide to damage levels from groundborne vibration', suggests that for 'reinforced or framed structures, industrial and heavy commercial buildings', cosmetic damage may be expected to occur for vibration levels of 50 mm/s and above for signals that are 4 Hz and above. Minor damage may be expected to occur at twice this level.
5.7.3 The previous results measure the magnitude of the vibration in terms of acceleration. If the signal is again assumed to be sinusoidal, then the PPV can be estimated.
5.7.4 The event with the greatest magnitude was measured on the slab of the 6th floor. This event had a PPV of 1.0 mm/s and a frequency of 7.5 Hz.
5.7.5 Therefore, we do not expect any form of damage, cosmetic or structural, to occur from vibrations caused by vehicles passing the expansion joint on the flyover.
6. RECOMMENDATIONS
6.1 There is little than can be done to reduce the magnitude of the vibration pulse from the flyover unless there is a structural defect in the expansion joint.
6.2 The vibration is more perceptible on the higher floors of the building. Relocation of vibration sensitive procedures and/or personnel to lower floors may reduce the impact of the vibration events on the working of the company.
6.3 If the raised floor were to be replaced at some future time, then a floor that is heavier than the existing one, with short spacing between the supports in any direction (<1 m) may vibrate less than the existing one. However, we would expect that the effect may not be noticeable.